Red Channel Details
ITL/STA Detector Information The Red Channel detector has several issues. Please see below for details. We do not recommend its use at this time.
| Grating (lines/mm) | Blaze (order/λ Å) | Blaze Angle(°) | Anamorphic Mag | R (@ Blaze, 1″ slit) | Resolution (Å or Å/order) | Dispersion (Å/pix) | Coveragea (Å) |
| Echellette | 11th/5235 | 26.8 | 3270 | 1.6 | 0.58 | 599 | |
| 150 | 1st/4800 | 2.2 | 0.98 | 230 | 21.0 | 6.37 | 6574b |
| 270 | 1st/7300 | 5.9 | 0.94 | 640 | 11.4 | 3.59 | 3705b |
| 300 | 1st/4800 | 4.3 | 0.96 | 460 | 10.3 | 3.21 | 3313b |
| 600 | 1st/4800 | 8.6 | 0.92 | 960 | 5.0 | 1.63 | 1682 |
| 600 | 1st/6310 | 11.4 | 0.89 | 1290 | 4.90 | 1.64 | 1692 |
| 1200 | 1st/5767 | 21.1 | 0.80 | 2620 | 2.20 | 0.82 | 846 |
| 1200 | 1st/7700 | 28.7 | 0.73 | 3930 | 1.96 | 0.80 | 826 |
| 1200 | 1st/9000 | 32.7 | 0.67 | 5097 | 1.77 | 0.78 | 805 |
| Lo-res Ech. | 7th/5134 | 8.6 | 920 | 5.6 | 1.74 | 1796 | |
| Hi-res Ech. | 18th/5790 | 25.7 | 3620 | 1.6 | 0.67 | 691 |
Theoretical Blaze Functions
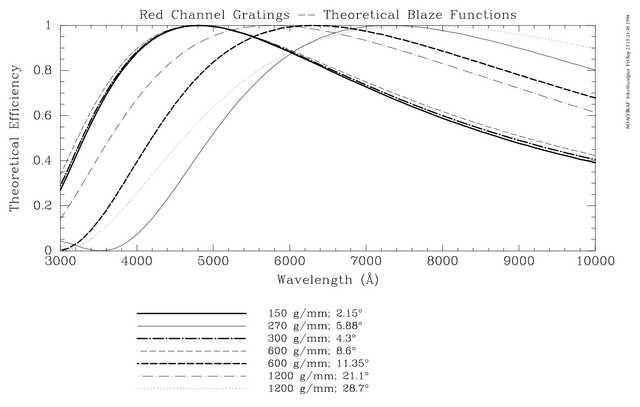
View a pdf plot of the theoretical blaze functions.
Spectrograph Throughput
An illustration of the expected count rate (for a flat-spectrum (in F_nu) source of 1 micro-Jansky) per Angstrom is shown below.
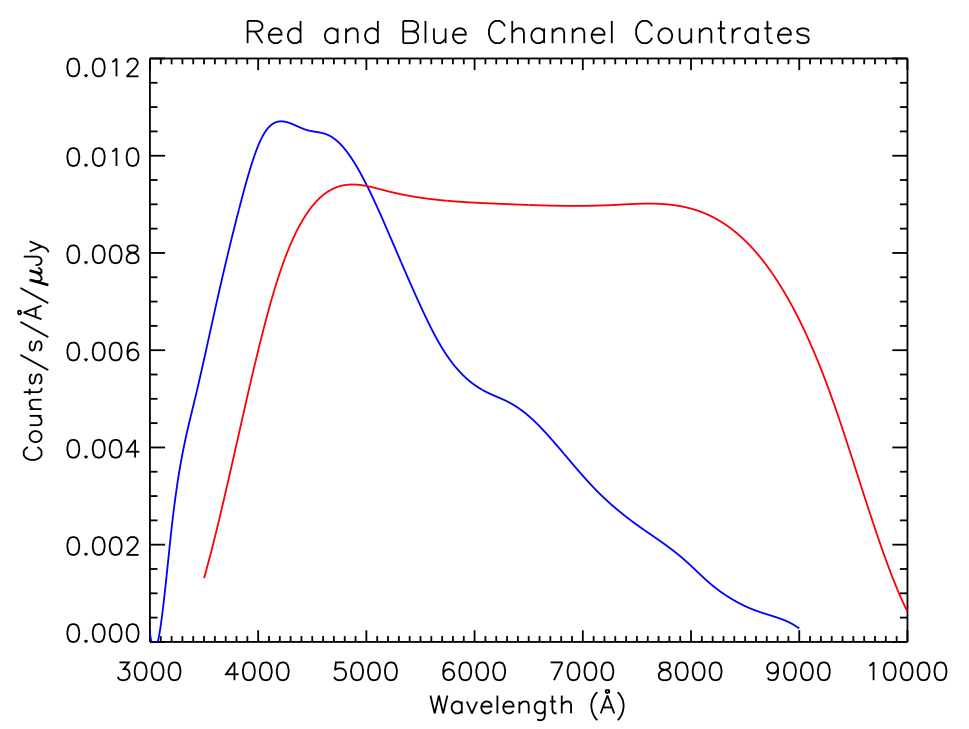
The same data can be found in PDF form and in tabulated form (Blue Channel, Red Channel).
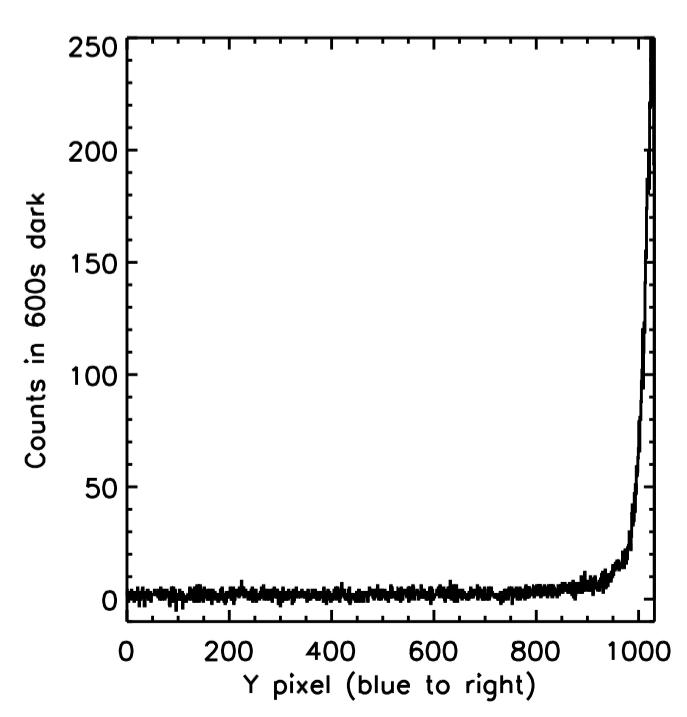
Red Channel Detector Glow
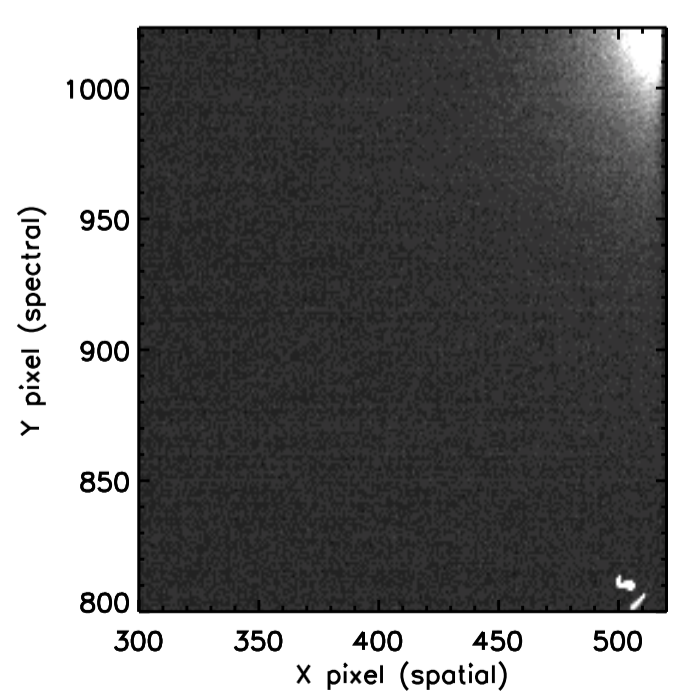
In Fall 2014, the Red Channel detector developed a “glow” on the blue edge of the detector. This signal is well localized to the corner of the detector, so point source observations and observations focused on the red portion of the detector will likely be minimally effected. Observations of extended sources and programs that utilize the bluest portion of the observed spectrum may be impacted by the signal and its associated noise. A two dimensional image of the bluest portion of the detector is shown below (the spectral direction of the detector runs in the Y-direction, so blue is up in the figure). The image is a bias-corrected dark image. The counts in the “glow” in the upper right depends on exposure time, so observers using long integrations are encouraged to take dark frames. On the right, we show the median counts in this 600s bias-subtracted dark frame in the last 3 columns; again, the bluest portion of the red channel image is at higher Y-pixel values.
Cross Dispersed Echellette Mode
The Red Channel Echellette grating gives complete coverage from 4300-8900 Å at a spectral resolution of a near-constant 90 km/sec when using a 1″x20″ slit. Nominally it works in orders 7-13 but it can be used in orders 6-13 with some sacrifice of coverage in the blue and some order overlap between orders 6 and 7. Due to the Red Channel detector glow, we do not recommend the use of Echellette at this time. The echellette should be used near its blaze at a tilt of 4.555 V (confirm, old value = 4.675), corresponding to a central wavelength of about 5250 Å in order 11. The cross-disperser should be set at 480 to put order 7 at the top of the frame; to get order 6 at the top, set the cross-disperser at 430.
Sample Echellette flat-field image: Blue is at the bottom and to the left. Orders are marked. This image was taken at a cross-disperser setting of 480. By judicious placement of the camera in the cross-dispersion direction, it is possible to include order 6, which is off the top of the frame, at the expense of a few hundred A in order 13.
Sample Echellette HeNeAr image: Strong Helium comparison lines are marked.